A few days ago I made a picture of artists in punk rock bands and the relationships between them based on the bands they have played in. Click to make it bigger:
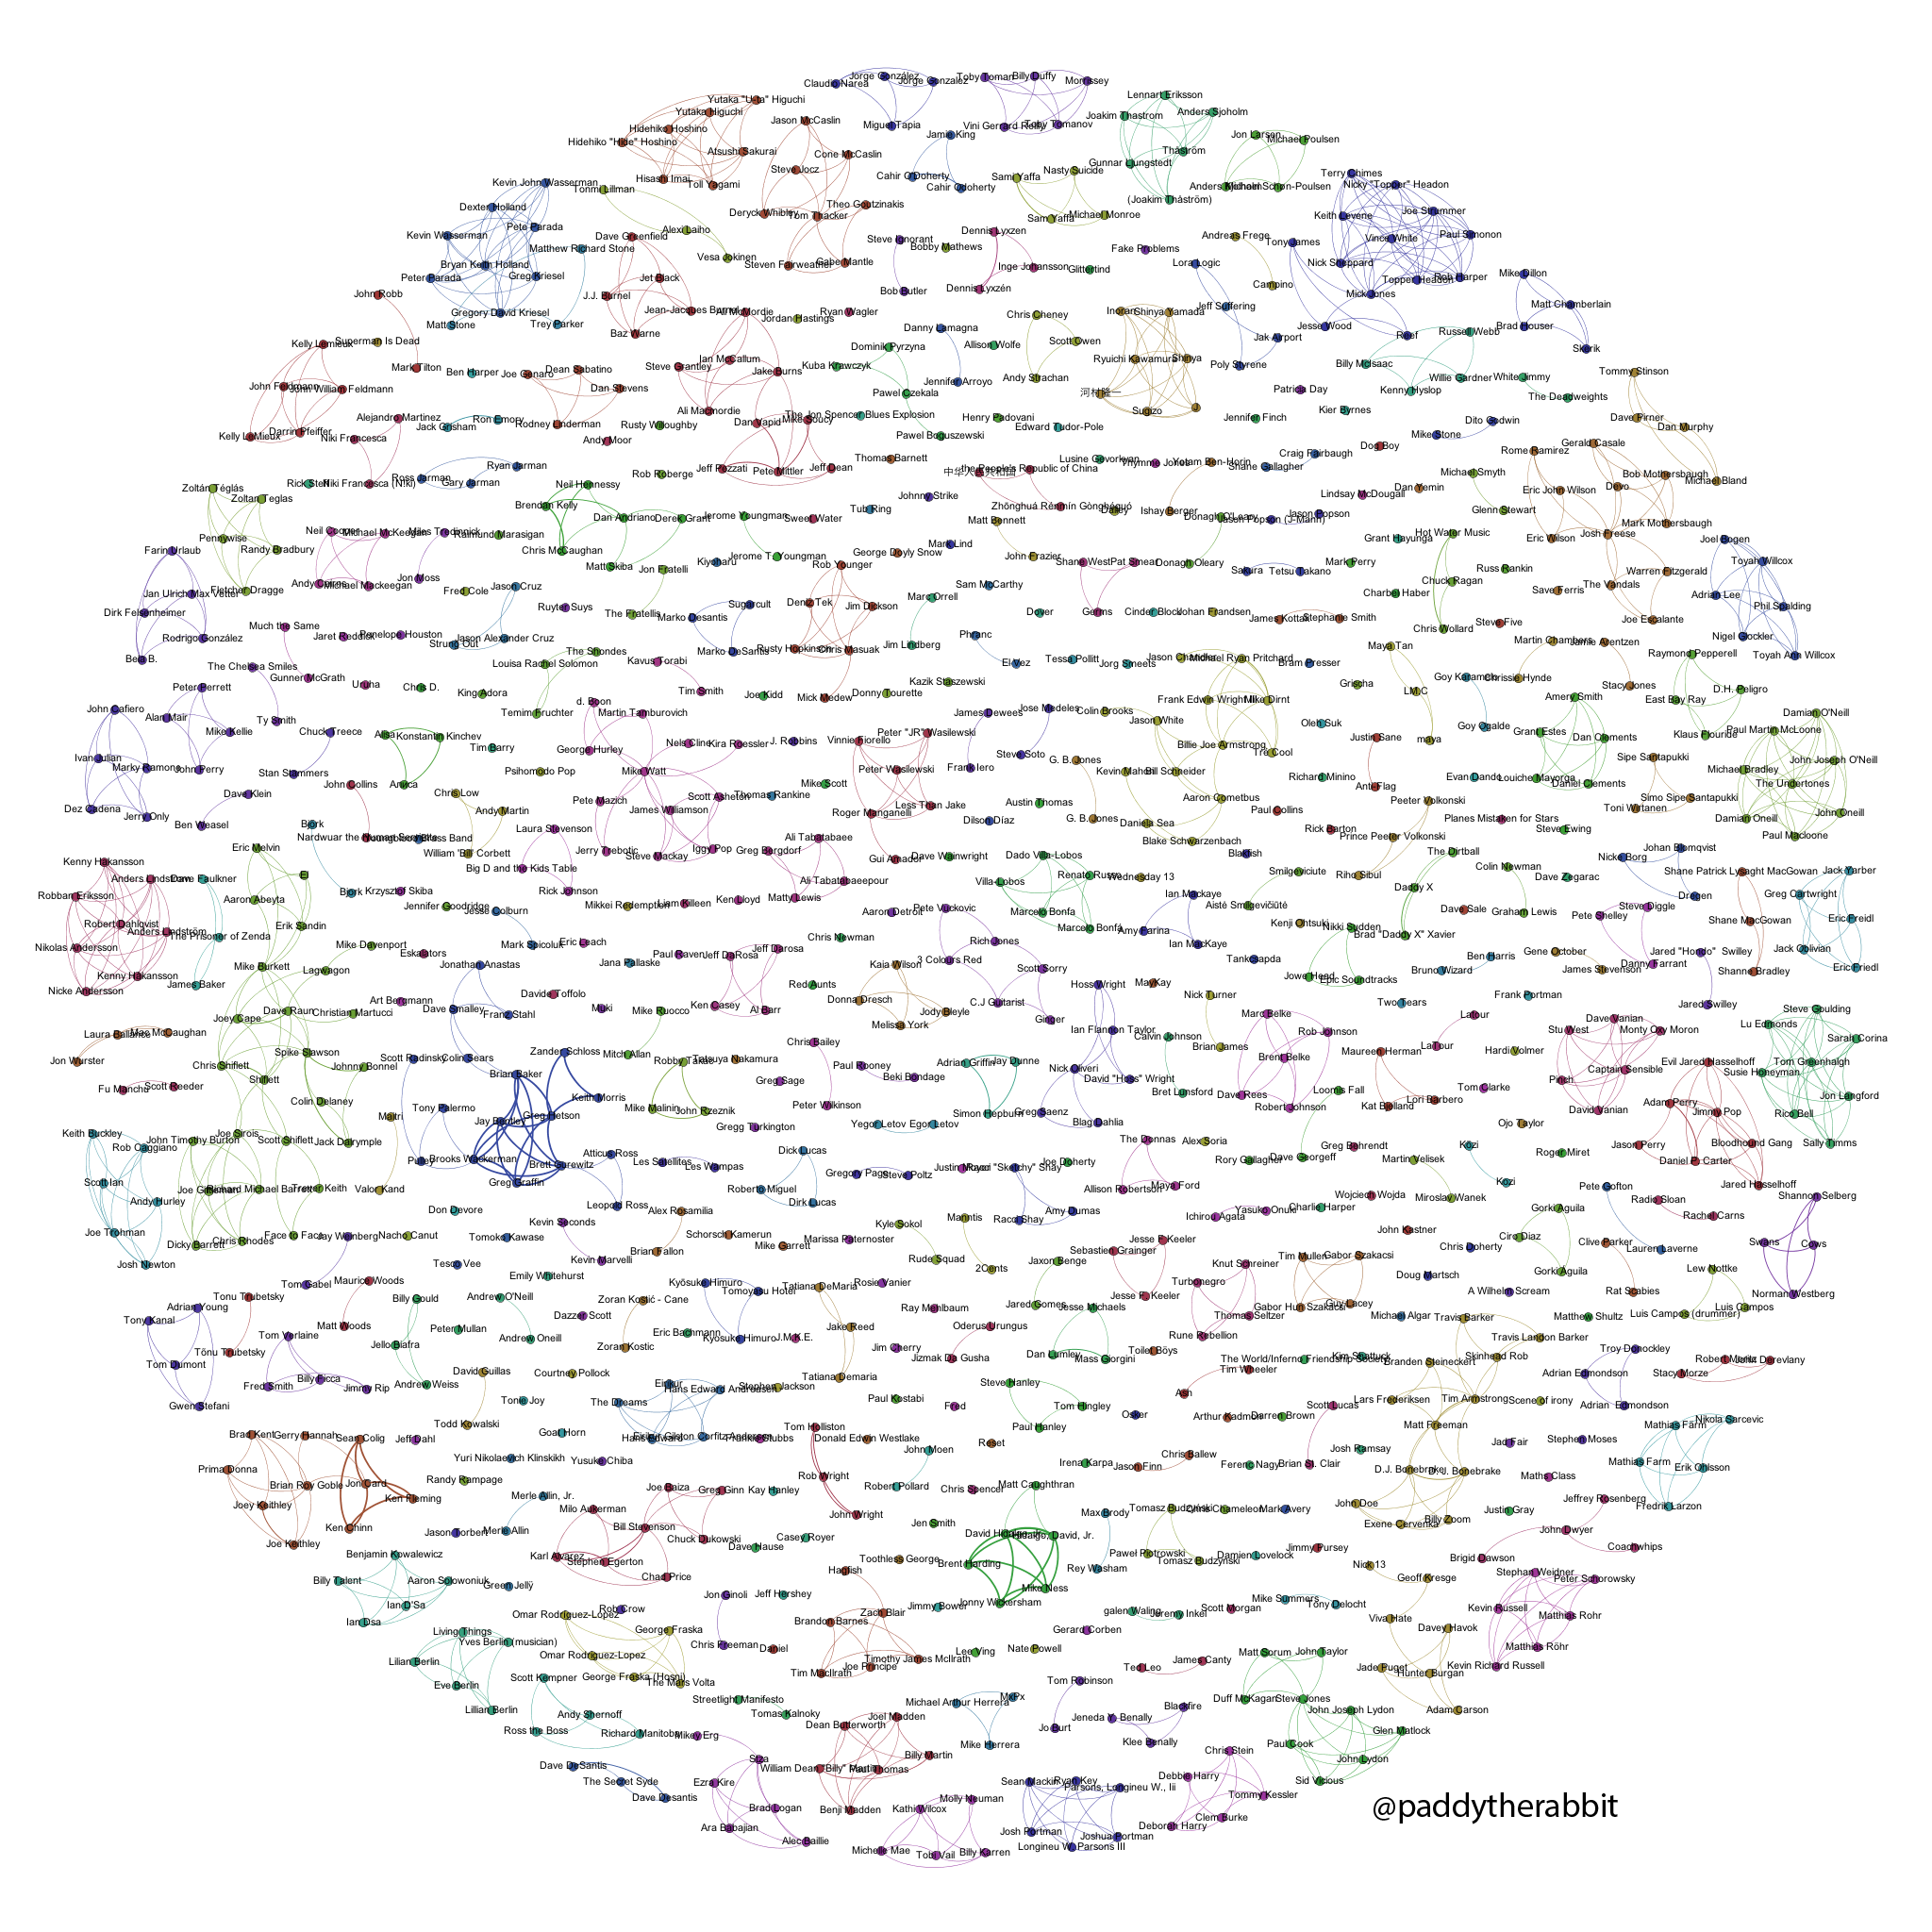
I grabbed the data from the dbpedia endpoint on the web, put it into google refine, exported it to R to turn the data into a matrix then exported it as a graphml file for Gephi. You can see the steps I took in a video I made which lives in this post.
It turns out that R can in fact do the SPARQL query and sort out the data itself, meaning that the first two steps in the process can be cut out. I made a video to show how I did it:
Here is the full script, this should generate a graphml file you can use in Gephi.
[codesyntax lang=”text” lines=”no” container=”none”]
library("SPARQL")
library("igraph")

endpoint = "http://dbpedia.org/sparql"

query = "SELECT ?name ?bandname where {
?person foaf:name ?name .
?band dbpedia-owl:bandMember ?person .
?band dbpedia-owl:genre dbpedia:Punk_rock .
?band dbpprop:name ?bandname .
}"

qd= SPARQL(endpoint, query)
df = qd$results

M = as.matrix( table(df))
Mrow = M %*% t(M)

iMrow = graph.adjacency(Mrow, mode = "undirected")
E(iMrow)$weight iMrow write.graph(iMrow, file="graph.graphml", format="graphml");
[/codesyntax]


0 Comments