Last week at the University of Bolton we put on a workshop for final year students that were about to embark on a job hunt. While the workshop was held in conjunction with the careers advice service and there was chance to give students a hand with practical things such as CV writing and interview technique we also wanted to get the students to talk to one another, reflect and share experiences from their time at the University to boost their confidence and help each other identify things such as transferable skills and job hunting tips.
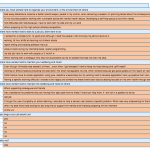
Before the event I built some bits of software with the aim to provide Sheila and Stephens first possibility of Learning Analytics. That is the possibility that learning analytics could allow ‘individual learners to reflect on their achievements and patterns of behaviour in relation to others’. The software was quite simple, there were two sets of widgets, one set of widgets was designed to collect information from the students. This set of widgets was mode up simple text forms of checkboxes that the students could access on their laptops/phones/ipads. Questions where asked in a variety of ways, sometimes the widget itself would prompt the student with a question and waited for an answer (what the questions were and when they where asked were controlled by staff) and sometimes they were simply asked to input answers/thoughts/feelings during various stages of an activity (involving an activity with play doh!).

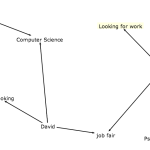
Example Tree Widget, at this stage most students claimed they weren't on the job hunt.. (Click to enlarge)
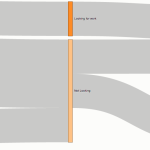
The other set was designed to show the students how their experiences related to those of other students by a series of d3.js powered visualisations. Each of these widgets had a single visualisation on and a collection if them where shown on a dashboard at the front of the workshop hall and were updated in real time, so that if a student added a response to an input widget they could instantly see how it fit in to the big picture. Students also had the ability to take away single visualisations and interact with them on their own devices.
We had approached the event with quite a ‘handwavy’ idea, we weren’t sure if the visualisations or data would mean anything to the students, my colleague was writing bits of code 5 minutes before the event and at one point I had to add some data sanitization during one of the exercises, to keep the widgets alive. Still, the students seemed to really like real time feedback from the analytics. Students regularly checked the dashboard waiting for their answers to pop up on the screen to see who gave similar answers and where their answers sat in the grand scheme of things. Most importantly it got them talking to each other, the input widgets gave them the ability to go back and change answers and there were some tactical changes between groups of students to improve what their future picture looked like.
My todo list:
- Fix Widgets, get a working demo!
- Work on ways to share the activity (via OMDL)
- Try to capture more data next time
The widgets are in a sorry state with lots of bubblegum code and hacks sticking bits together. Better sort them out and get a working demo up!
Lots of students (particularly psychology students!) liked the real time dashboard of answers and wondered if they could implement it themselves for their own events. This isn’t a problem if the widgets are to go in Moodle or Apache Rave then this wouldn’t be a problem since we can use ODML, essentially a MarkUp language that defines widgets and their layout so they can be moved from one platform to another.
Feeding the data back to the students was interesting but I wonder what we can learn about our event from it? Something I didn’t collect but would be interested in was the points of the event where the students decided to change their data. I wonder what it was that made them change their answer from ‘not currently looking for a job’ to ‘desperately applying for everything’.


2 Comments
Sheila MacNeill · June 20, 2013 at 10:30 am
Hi David
Just getting round to reading this just now. Really exciting demo – hopefully you’ll be able to do a bit more refining and use again with students. But certainly what you did already shows the power of real time feedback and visualistaions
dms2ect · June 20, 2013 at 10:35 am
Hi Sheila
I’m wondering what to do with it at the moment, the software was kind of rushed for the event we did so I’m thinking of rewriting most of it from the ground up. Software aside I think the feedback from the students was the most valuable thing. They really liked the real time feed back and it made me realise that sometimes it doesn’t have to be really complex information that being displayed – just information thats relevant to them.
I have some videos and pictures, but I am waiting for the students to give me the OK to use them.