Recently I have been playing with the Twitter API, to get my head around how it works and what is/isn’t possible. Just to get my head going I have been looking at the ways in which UK Universities pimp themselves on Twitter. I haven’t really thought through my dataset or the kind of questions I want to ask it since I’m simply just trying out the API, but after playing I have ended up with a bunch of notes which I am dumping here because this will be the place I look in 3 months when my hard drive has died. The notes are basically just the commands I typed and the order I typed them, but I think they are straight forward enough to follow with little explanation, the process is very easy. So with that in mind here are some caveats to anybody looking for answers from a Google search:
- I haven’t thought about the best way to display data and have been playing with tools like ggplot, I know this is messy, this was a learning process for me.
- The notes on how I’ve gone about using SQL queries/R/Javascript were taken just to jog my memory. I’m sorry if they are not helpful. I will try and tidy this up at some point.
- Data is correct as far as I know, I think I’ve fixed the holes, but I haven’t gone through it with a really fine comb.
- I have used 163 Institutions from this list as a starting point. I needed to update some of the accounts. 160 Seemed to have twitter accounts. I had to update lots of the accounts.
- Institutions have different approaches to Twitter usage, Bolton has its accounts spread over the library, helpdesk etc etc and I have only captured the main account. This makes it hard to compare one University to another.
- Data is tweets from 10-17th March
- I seem to have lost the number of favourites and retweets somewhere along the line and will need to revist my scrapper
These notes are for my own use, the actual thing I’m working on doesn’t even use higher ed tweets, still I’d welcome any friendly comments if any of this seems useful.
Here be dragons:
Check if anybody is missing
SELECT * FROM University
WHERE University.twitter_username NOT IN
(
SELECT twitter_id
FROM amt_tweets
)
The following didn’t have Twitter accounts that I was aware of:
Bishop Grosseteste University College Lincoln
Courtauld Institute of Art
Norwich University College of the Arts
Stranmillis University College
Newcastle Uni has turned in to subaccounts, I’m not following any of them.
The University of Wales and University for the Creative Arts didn’t tweet that week.
Delete anything that doesn’t belong in the week:
delete from amt_tweets where created_at < "2014-03-10 00:00:01" delete from amt_tweets where created_at > "2014-03-17 23:59:59"
Give me something to join
UPDATE University
SET twitter_username = SUBSTRING(twitter,20)
Check my join to Uni stats has the same number of rows as select *
SELECT *
FROM amt_tweets
LEFT JOIN University
ON amt_tweets.twitter_id=University.twitter_username;
Find Tweets per Institution in that week:
SELECT University.Institution, count(*)
FROM amt_tweets
LEFT JOIN University
ON amt_tweets.twitter_id=University.twitter_username
GROUP BY University.Institution
Institutions with most Tweets
| Institution | Tweets |
| The University of Essex | 229 |
| Coventry University | 203 |
| Plymouth University | 186 |
| Aston University | 182 |
| The University of Keele | 174 |
Bottom 5 (not including the ones who didn’t tweet at all):
| Institution | Tweets |
| The School of Pharmacy | 2 |
| Heriot-Watt University | 2 |
| The University of Oxford | 5 |
| York St John University | 5 |
| University of the Arts, Londony | 6 |
Bored of SQL, Suck in to R
library(RMySQL)
library(tm)

#will need ln -s /Applications/MAMP/tmp/mysql.sock /tmp/mysql.sock
mydb = dbConnect(MySQL(), user='xxx', password='xxx', dbname='twitter_db', host='localhost')
query<-paste('SELECT *
FROM amt_tweets
LEFT JOIN University
ON amt_tweets.twitter_id=University.twitter_username')
data.frame = dbGetQuery(mydb,query)
dbDisconnect(mydb)
Crate a dataframe of Institutions, when they tweeted and graph it. Realise the mistake as you press the plot button
data.frame$date <- as.Date(as.POSIXct(data.frame$created_at, origin="1970-01-01"))
added_df<-ddply(data.frame, .(date, Institution), summarize, freq=length(date))
ggplot(added_df, aes(x=date, y=freq, col=Institution)) + geom_line()
Try again with Russel Group Members (are we missing 3?)
mydb = dbConnect(MySQL(), user='xxx', password='xxx', dbname='twitter_db', host='localhost')
query<-paste('SELECT *
FROM amt_tweets
LEFT JOIN University
ON amt_tweets.twitter_id=University.twitter_username
WHERE University.Group = "Russell" ')
data.frame = dbGetQuery(mydb,query)
dbDisconnect(mydb)
data.frame$date <- as.Date(as.POSIXct(data.frame$created_at, origin="1970-01-01"))
added_df<-ddply(data.frame, .(date, Institution), summarize, freq=length(date))
ggplot(added_df, aes(x=date, y=freq, col=Institution)) + geom_line()
Output:
The idea of this was to have a timeline of a group of Universities and plot when they were Tweeting over time compared to the others in the same group. Here I have used the Russel group. You can’t really tell anything apart from very few Russel group Universities Tweet on the weekend, which is when the Quidditch matches take place.
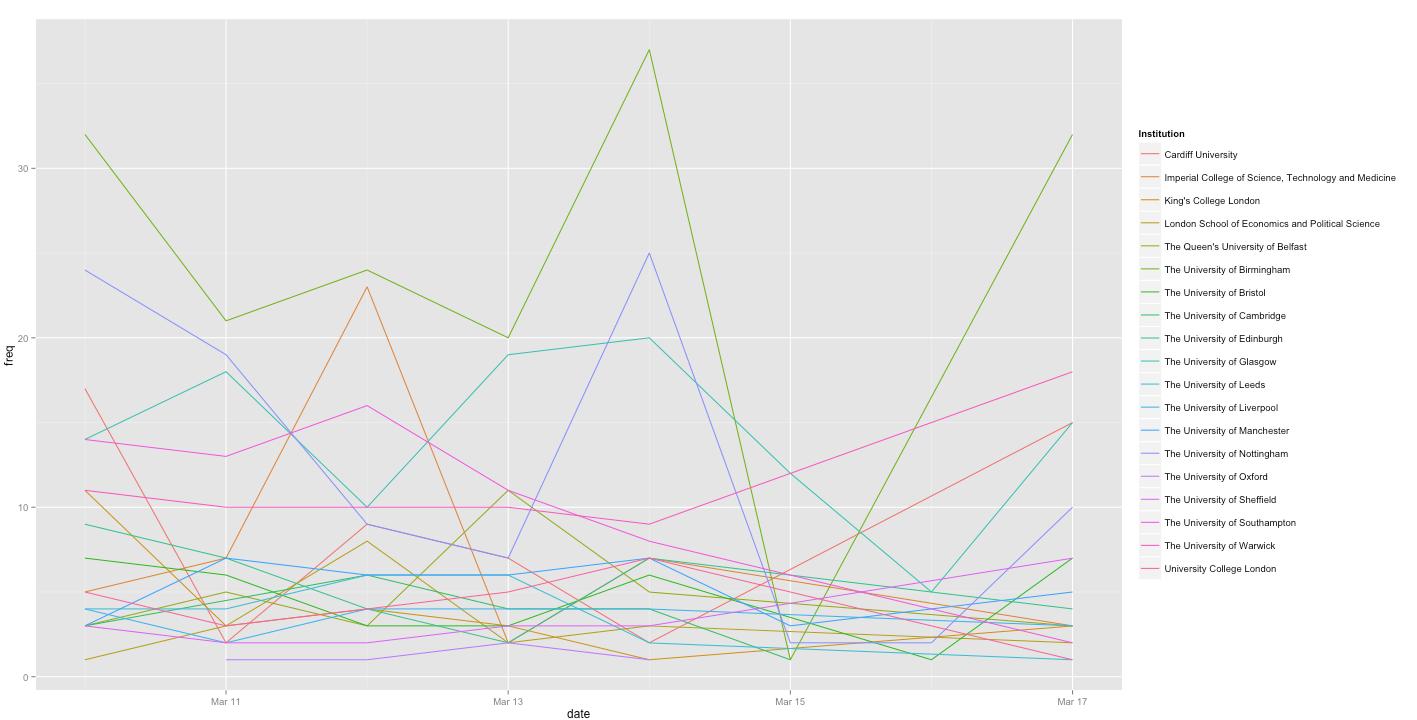
Number of tweets from Russel Group Twitter accounts week starting 10th March. Hard to tell what is going on
Try filling the lines.
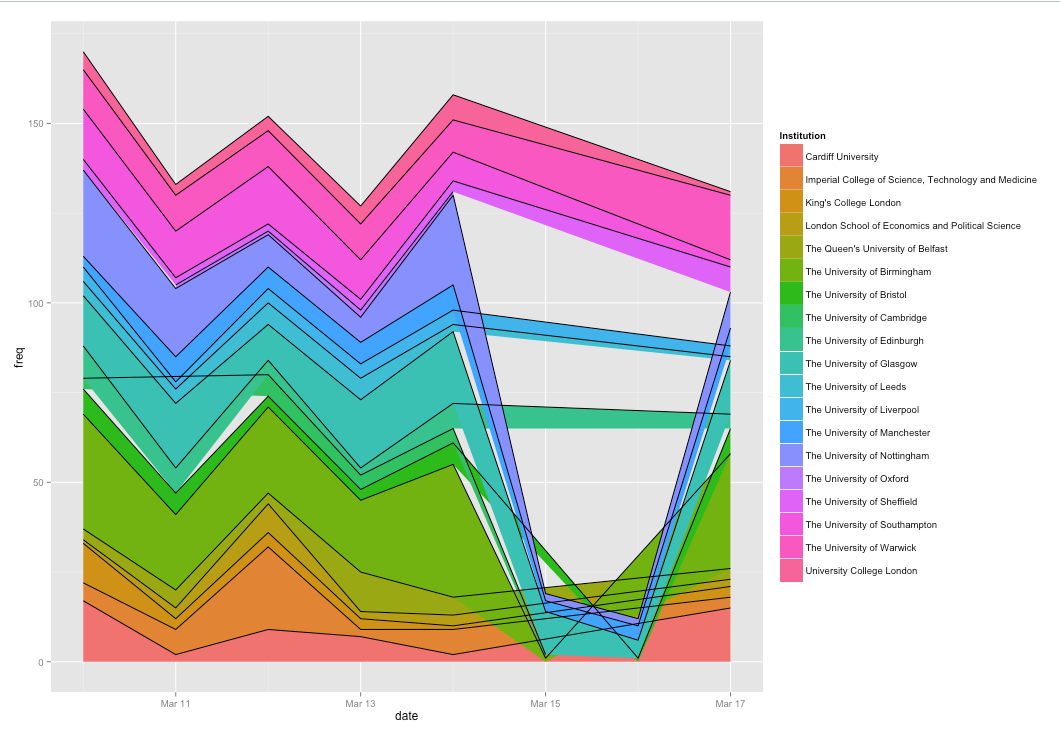
ggplot(added_df,aes(x = date, y = freq, fill=Institution, group=Institution)) +
  geom_area() + geom_line(aes(ymax=freq), position="stack")
Output:
I wondered if it would better to have the lines stacked. Turns out it wasn’t. This might be because I should have done it as a percentage instead of numbers, although I thought that ggplot2 would do that for me. Also may have worked better if removed weekend. It shouldn’t be too hard to turn the dataframe in to JSON and do something like this. Apparently Excel 2013 can do ‘Stream Graphs’ but I’m too cheap to own a copy.
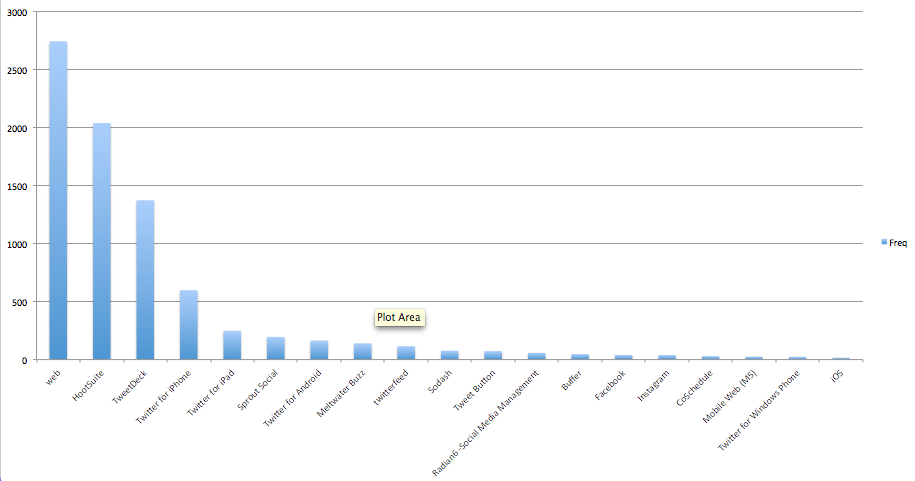
Find out what tools institutions use to send out their tweets
Then tested how easy it was to put it in CSV to try Excel visuals on it.
cleanFun <- function(htmlString) {
  return(gsub("<.*?>", "", htmlString))
}

source.frame<-data.frame(table(data.frame$source))
source.frame$tool <-cleanFun(source.frame$Var1)

write.csv(source.frame)
Output
This is a cheat really because the output is from Excel, I wanted to see how easy it was to give the data to somebody else. This is the top 20 tools and how many tweets were sent using them. Really interesting that iPhone and iPad take 4th and 5th place. I would have thought that they would have been hard to mange an account from. I seem to be missing axis labels. Don’t tell Miss.
Which twitter user is sent the most messages?
SELECT amt_tweets.in_reply_to_screen_name, count(*)
FROM amt_tweets
LEFT JOIN University
ON amt_tweets.twitter_id=University.twitter_username
Group by in_reply_to_screen_name
I’m not sure about this one because I don’t know Twitter well enough. Does this include Retweets? @hannah_fowler96 is the winner with 7 mentions. All of her Tweets were the University of Keele replying to her questions.
Giving Up
I’ve just noticed I haven’t captured retweets or favourites which is something I really needed.. So I’m going to give up and rewrite my scrapping module. oh well
Some final Text analysis
Find most freq terms:
#text
library(tm)
documents <- data.frame( text = data.frame$tweet, stringsAsFactors=FALSE)
corpus <- Corpus(VectorSource(data.frame$tweet))
skipWords <- function(x) removeWords(x, stopwords("english"))
funcs <- list(tolower, removePunctuation, removeNumbers, stripWhitespace, skipWords)
a <- tm_map(corpus, FUN = tm_reduce, tmFuns = funcs)
myDtm <- TermDocumentMatrix(a, control = list(minWordLength = 1))
#find frequent terms
inspect(myDtm[266:270,31:40])
findFreqTerms(myDtm, lowfreq=15)
[1] NA “amp” “campus” “can” “congratulations”
[6] “day” “free” “get” “glasgowuni” “great”
[11] “hopefully” “know” “new” “now” “offer”
[16] “open” “receiving” “research” “see” “soon”
[21] “student” “students” “the” “today” “unibirmingham”
[26] “unisouthampton” “university” “warwick” “will”
See associated terms for some of these, for the word free:
#find  terms
findAssocs(myDtm, 'free', 0.25)
free:
game 0.35
mooc 0.35
reserve 0.35
cardiffuni 0.28
sustainability 0.28
ticket 0.28
for the word hopefully:
#find frequent terms
findAssocs(myDtm, 'hopefully', 0.25)
hopefully
receiving 0.94
warwick 0.88
soon 0.84
offer 0.81
congratulations 0.76
campus 0.74
see 0.71
will 0.60
jaiminpatel 0.34
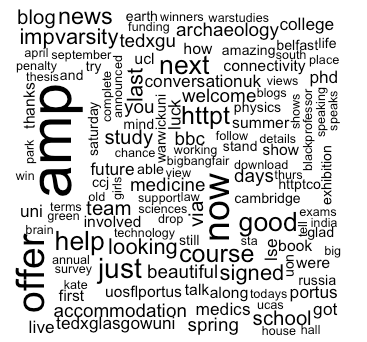
Lets wordl this badboy:
library(wordcloud)
 m <- as.matrix(myDtm)
 # calculate the frequency of words
 v <- sort(rowSums(m), decreasing=TRUE)
 myNames <- names(v)
 k <- which(names(v)=="miners")
 myNames[k] <- "mining"
 d <- data.frame(word=myNames, freq=v)
 wordcloud(d$word, d$freq, min.freq=3)
General notes:
Lots of Universities change their account, just a name change. Many messages saying, “we are now tweeting from this account..”
Universities have different ways of organising their twitter accounts which make all this stuff a bit wobbly. Most Unis have a ‘main’’ account with sub accounts for the library and the Union etc. While I’ve tried to analyse the main accounts it does mean that the different universities put different stuff on that account making it hard to analyse. Newcastle Uni doesn’t even seem to have a main account, just sub accounts.
I haven’t really researched in to if anybody is doing anything along these lines to compare my work as it was more a way of just trying out various techniques. However the amount of analysis along the lines of “Institution X Uses Twitter more than Institution Y. Conclusion X is good, Y is bad” was pretty shocking. There must be more out there when it took two episodes of coronation street to do a simple overlook. Maybe Twitter is stopping people, people don’t care, or I didn’t look hard enough.
Twitter API terms and conditions are a moving target as Twitter try to stay viable. Still, at time of writing I think I am OK to store <100,000 Tweets .

1 Comment
Budget 2014. Conservative and Labour on Twitter | Paddy the Rabbit · March 23, 2014 at 11:52 pm
[…] does this, but I couldn’t work it out. At first I tried some techniques to grab tweets from HE institution accounts. The storing went OK, but the analysis fell flat. I decided to try using the framework I came up […]